

Power BI Report Design
Get reports that will make it easier for users to understand the data and help them make appropriate decisions
The design of a Power BI dashboard is critical to effectively presenting data insights to stakeholders. A well-designed business intelligence dashboard can provide users with a clear and concise understanding of the data, allowing them to make informed decisions. In addition, a user-friendly interface is important so that users can easily navigate and understand the information presented.
The strategic importance of Design
Often, employees do not use reports due to their overload, non-interactivity, difficult access and lack of relevance to needs. This forces them to bypass formal reports, refer to colleagues, or make decisions based on gut feeling, leading to errors and inefficiencies.
We review and transform existing dashboards, align KPIs and company goals, and help integrate them for effective use.
Our Approach to Designing Power BI Reports
We take a comprehensive approach, taking into account the specific needs of your business and integrating them into Power BI reports. Our team works with you every step of the way to ensure we create reports that meet your requirements and values.
Requirements gathering and business needs analysis
We determine the goals of reports and key performance indicators, hold meetings with key users to gather requirements, distribute reports by role.
Designing and layout of reports
We develop a concept and create a prototype. We choose a style and color scheme that matches the brand and create report layouts that meet the requirements collected.
We configure data flows and Roles
We configure data flows for uninterrupted updating and access to information. We also define user roles to control access, ensuring security and correct distribution of information between team members.
We select the right data visualization
We choose the appropriate types of visualizations for each data set. This includes analyzing data and determining the most effective ways to present it to ensure maximum understanding and convenience for users.
Development and customization of visualizations
We create interactive elements and dynamic visualizations. We optimize reports for different platforms and devices, ensuring their functionality and ease of use.
Testing and implementation
We finalize and test reports to ensure their high performance and accuracy. After that, we implement reports in your organization.
Cooperation options for your business
We offer various cooperation models that allow you to choose the best option according to your needs and specifics of your business.
Project work
- The scope of work is clearly defined
- Fixed terms
- Fixed cost
- An ideal choice for projected projects
Outsourcing
- Flexibility in performing tasks
- Regular reports
- The possibility of making changes
- Quick response to changes
Outstaffing
- Provision of specialists
- No hiring required
- Focusing on core processes
- Cost reduction
Advantages of cooperation with us
Experience and expertise of our team
We have many years of experience working with Power BI and creating unique reports for different industries
Flexibility and adaptability to changing business needs
We respond quickly to changes and ensure the effectiveness of your reports in any environment
Individual approach to each project
We develop solutions that fully meet your requirements and goals
Have a question?
Find answers to frequently asked questions about Power BI Dashboard Design and join our happy customers.
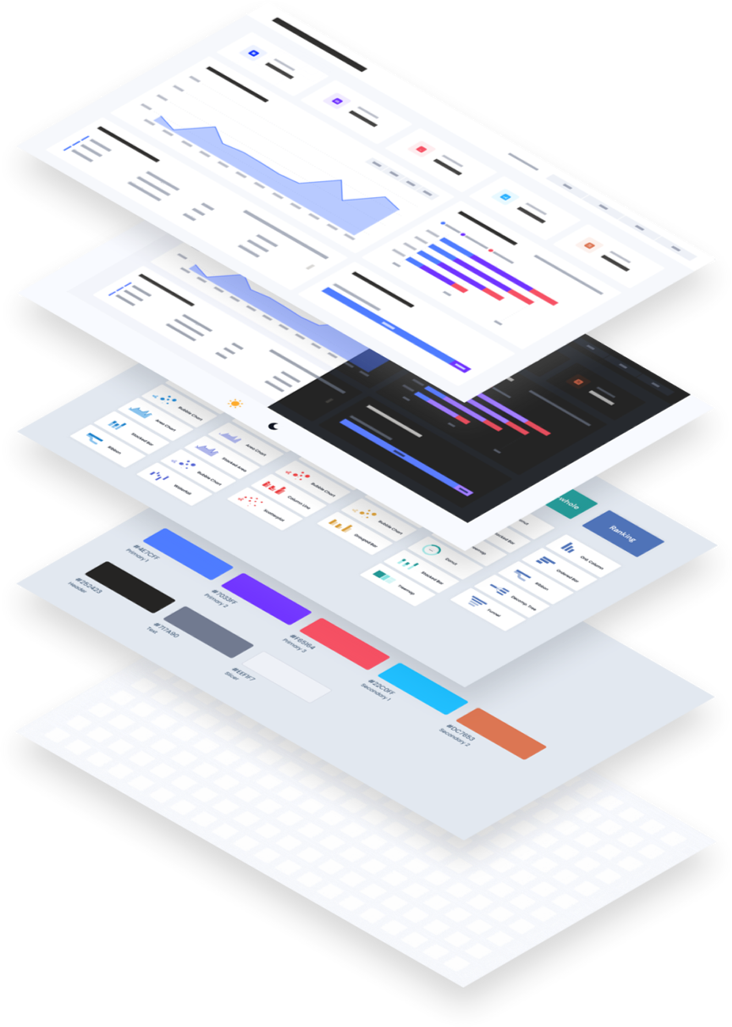
Our solutions will help you implement best practices UX/UI reporting, optimize for mobile and desktop devices, implement interactive elements and dynamic visualizations and get an intuitive interface!
- Professionalism and experience
- A comprehensive approach to tasks
- Innovative technologies
- Individual solutions
- Support and development
Ready to take your analytics to the next level?
Contact us today to discuss your project and find out how we can help you create Power BI reports
Leave a request
Use modern services, automate processes, analyze data and grow together with the FMP Company.

